Key Metrics To Track In Your Campaigns & Sales Funnel
When iterating and optimizing your cold outreach campaigns, the following 3 metrics are critical to know:
- Positive Reply Rate (Leads Emailed → Positive Replies)
- Lead Magnet Request Rate (Positive Replies → Lead Magnet Requests)
- Call Booking Rate (Lead Magnet Requests → Meetings Booked)
With these metrics, you have a lot of what you need to gauge the efficacy of your “TOF” (Top Of Funnel) conversion strategy.
But that said, it’d be smart to track further down the funnel too, so let’s look at that and how you can track all of this within LeadTables.
Why You Should Track Full-Funnel Metrics
Story time: back in 2009 when I was a lil baby starting my first web design+dev agency, I had a cold calling team (a.k.a. ”setters”) & an outbound sales team (a.k.a. ”closers”).
There was this one setter, John, who was really good at setting a lot of appointments.
BUT!!!— his appointments were somewhat low quality.
The appointments had a lower close rate those set by other team members, and they often no-showed.
If we’d only tracked meeting sets, John would have seemed like a superstar, but in reality, my closers really didn’t like when they were handed his leads due to the quality issues and time they’d waste as a result.
The lesson here is that sometimes certain “top-of-funnel strategies” seem good at first glance but cannibalize sales conversions further down the funnel.
And if you stop tracking your funnel metrics at “meeting booked,” you’ll never know when that’s happening.
Fortunately for you, LeadTables allows you to track engagement across your entire funnel so that you can deeply understand your funnel performance and see a zoomed-out holistic “overall funnel throughput conversion rate,” which will allow you to build better campaigns and get more clients booked over time.
(Check out the screenshots at the bottom of this page for a demo of what the Campaign Metrics page looks like)
When you have this data, you’ll be able to know exactly what your CAC (Client Acquisition Cost) is, which is the foundation of profitable scaling.
How Funnel Metrics Are Tracked In LeadTables
In LeadTables, you don’t need to worry about math in order to know your metrics.
All you need to do is “Mark Campaign Interactions” for your leads and all your metrics & conversion rates will be auto-calculated for you!
You can also bulk-add counts after your campaign is over if you don’t want to manually track individual interactions.
(We’ll walk through how to do each in an upcoming lesson.)
Funnel Metrics You Can Track In LeadTables
At the time of writing, LeadTables supports tracking the following metrics and interactions in your campaigns.
(NB: If you’re in $200k Freelancer, you’ll notice that this largely mirrors the phases in the 🎉 Offer + Funnel Validation Milestones (And Action Steps) Cheat Sheet from the Campaigns section of the course.)
- Positive Reply Rate
- Lead Magnet Request Rate
- Lead Magnet Consumption Rate
- Call Booking Rate
- Call Show Rate
- Intro Offer Close Rate
- Flagship Offer Ascension Rate
Let’s take a look at each.
☝️ NB: If You Think Math Is Scary…
Before we start, remember that LeadTables auto-calculates everything for you, so don’t feel like you have to understand / retain the formulas below if they overwhelm you!
Positive Reply Rate
This is defined as “leads who respond positively to your outreach.” (Interest, questions, asking for your lead magnet, etc.)
Note that LeadTables defines the “positive reply rate” metric a little differently than how sending platforms like Instantly & SmartLead define their primary “reply rate” metric, and how they display their “positive reply rate” metric to you.
(We’ll deep-dive into the “why” in the next lesson.)
In LeadTables, Positive Reply Rate does NOT include out-of-office replies, unsubscribe requests, “wrong person” replies, etc.
The LeadTables definition of “positive reply rate” looks like this…
- 🧮 Formula:
Positive Reply Rate=Positive Replies/Campaign Recipients
- 💭 Example:
- So if you email 10,000 leads and 100 of them are interested, that’s a 1% positive reply rate. (100 positive replies / 10,000 leads = 1%)
- 📈 Useful For:
- Knowing how much your emails are resonating with your leads
Lead Magnet Request Rate
This is the number of positive replies who actually wanted your lead magnet — i.e. the Loom video audit you offered (or whatever your first email’s value-forward CTA was).
(💡 Sidebar Free Tip! Your initial cold emails should always include some kind of value-forward CTA (Call To Action). If you’re cold emailing people asking them to hire you outright with no value-forward CTA at all, that’s also known as “spam” and won’t convert well. 🙂)
Usually your Lead Magnet Request Rate will be 90%+, and primarily will exclude people who replied to your cold email with something like “tell me more” but then ghosted prior to confirming interest in the lead magnet.
(NB: If your “lead magnet” is higher friction, like a call, the conversion rate will likely be lower.)
- 🧮 Formula:
Lead Magnet Request Rate=Lead Magnet Requests/Positive Replies
- 💭 Example:
- If 100 people reply positively and 90 request your lead magnet, that’s a 90% Lead Magnet Request Rate (90 lead magnet requests / 100 positive replies = 90%)
- 📈 Useful For:
- Knowing how interesting people find your lead magnet / how well you position it
Lead Magnet Consumption Rate
This is the number of leads who asked for your lead magnet that actually consumed it.
I.e. watched the video, downloaded the pdf, whatever.
Depending on your lead magnet, you may or may not want (/be able) to track this.
BUT it can be really useful for certain types of lead magnets.
- 💡 Useful For:
- Lead magnet delivered on a live call, e.g. a free strategy session, that’s separate from a proper sales call — The “request rate” could be people saying they’re interested/making bookings, and the “consumption rate” could be people showing up to the calls
- Loom video audits / automated video audits — You can usually enable view tracking to see who’s actually seen the video
- Free courses etc — Perhaps tracking logins, downloads, etc.
- 🧮 Formula:
Lead Magnet Consumption Rate=Lead Magnets Consumed/Lead Magnet Requests
- 💭 Example:
- If 90 people request your lead magnet, and 45 of them actually download it, that’s a 50% Lead Magnet Consumption Rate. (45 lead magnets consumed / 90 lead magnet requests = 50%)
- 📈 Useful For:
- Knowing how interesting people find your lead magnet / how well you positioned its value
Call Booking Rate
The amount of leads who book a call.
There are a few different ways the math for this can look, depending on how you configure your funnel in LeadTables, which we’ll talk about in an upcoming lesson.
The main thing to know is that the conversion rate is calculated based on whichever funnel step comes before it.
(So if you go Cold Email → Lead Magnet → Call, it’s based on the lead magnet; if you go Cold Email → Call, it’s based on the positive replies, etc.)
📈 Useful For:
- Gauging how much of a priority it feels like to your leads to solve this problem, either due to intrinsic qualities of the problem & solution, or how you positioned it
- Determining how valuable your leads believe the call with you will be
Call Show Rate
The amount of leads who booked calls that actually showed up for them.
💭 Example: If 27 people book calls and 24 people show up for them, you have an 88.9% Call Show Rate. (24 shows / 27 sets = 88.89%)
Introductory Offer Close Rate
The amount of leads that signed up for your introductory offer from the previous funnel step.
If you’re doing a “sales-call-free funnel” – i.e. selling right out of your lead magnet without doing any calls – it’d be the amount of lead magnet folks who bought your intro offer. Otherwise, it’s the amount of call attendees who bought.
Flagship Offer Ascension Rate
The amount of clients from your introductory offer that ascended into your primary / flagship offer.
💭 Example: If 8 leads become clients for your intro offer and 4 of those clients buy your followup flagship offer, you have a 50% Flagship Offer Ascension Rate (4 flagship clients / 8 intro clients = 50%)
☝️ NB: If you only have one product/service/offer in your business, you’d count it as your Introductory Offer, NOT as your “Flagship Offer.” More on this later.
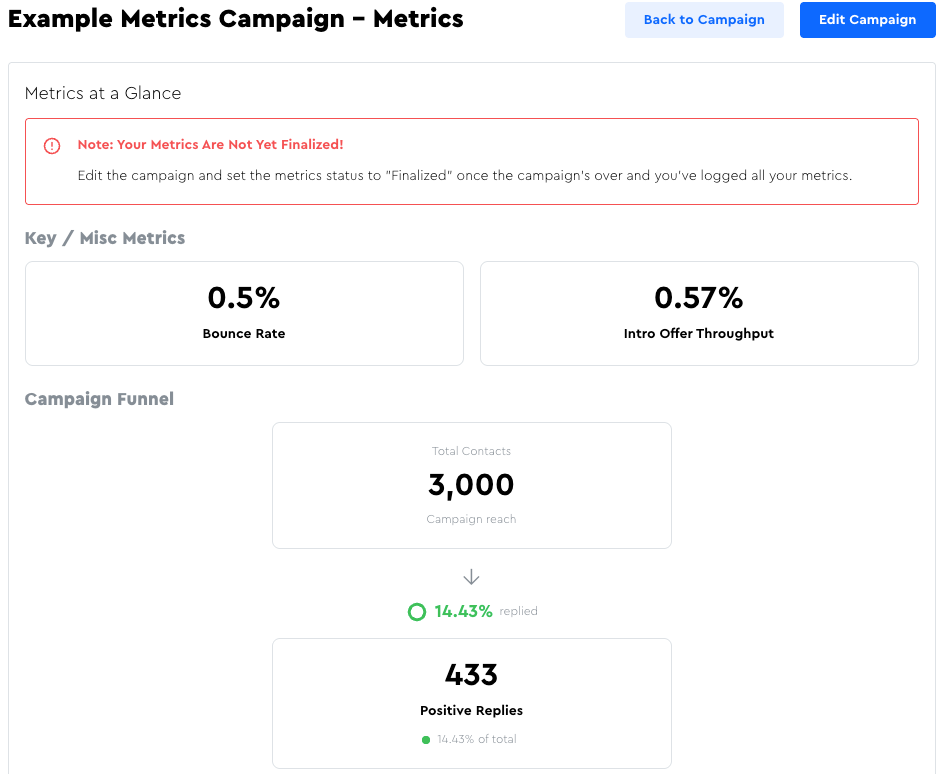
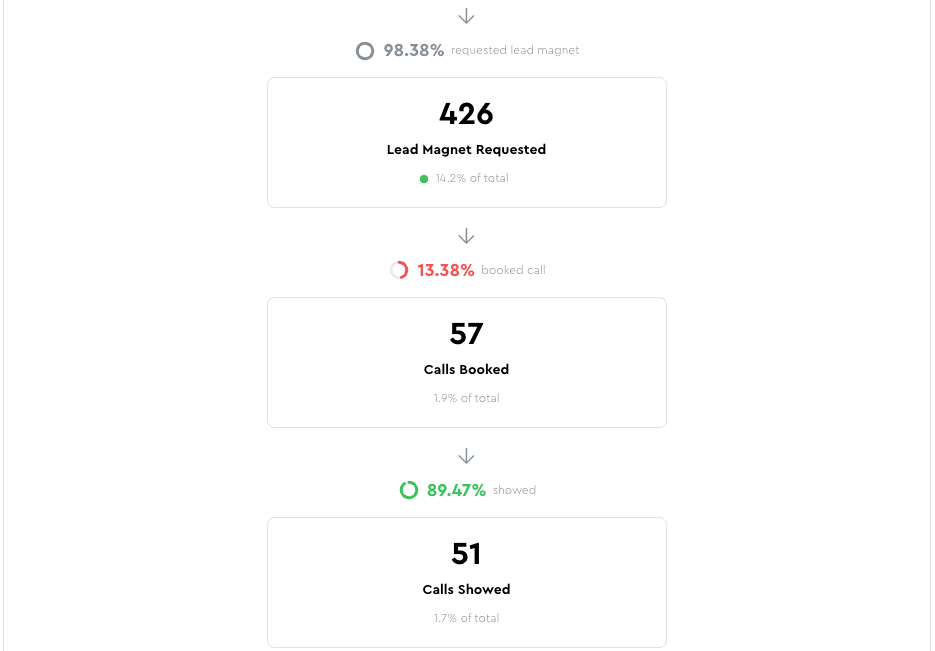
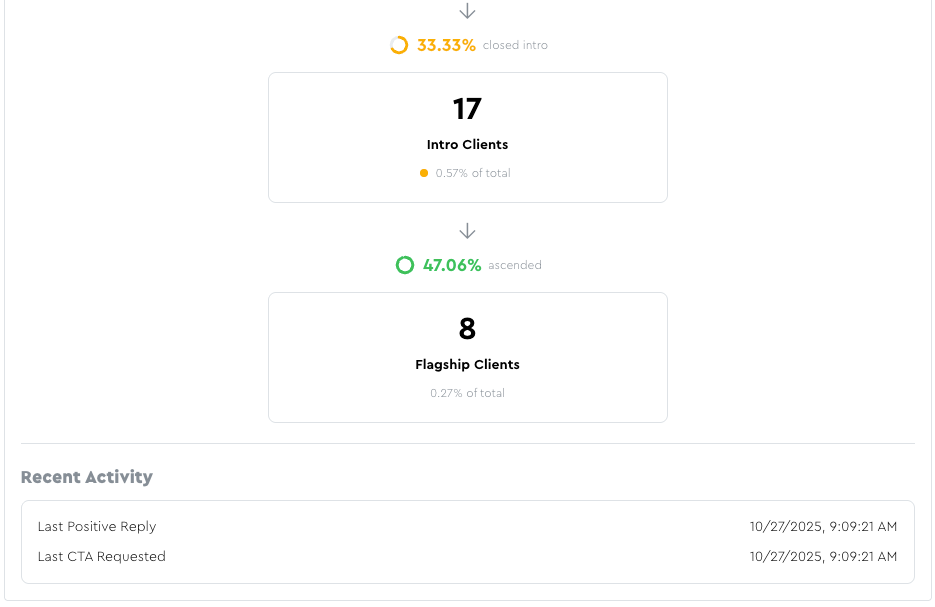
Example Metrics Output
When you’ve tracked interactions in your campaign (covered in an upcoming lesson) you’ll wind up with a nifty metrics page display like this: