How To Use The Campaign Forecaster
The “Campaign Forecaster” is a nifty tool I built to help you project campaign results & plan your A/B tests and funnel CRO (Conversion Rate Optimization).
You can find it in two places:
- Within a Campaign’s planner — You can save your forecasted projections to a specific campaign.
- Under the “Tools” menu in the main website navigation — Just an ephemeral, non-savable tool that you can use as a little scratch pad.
To start, we’ll play with it within a specific campaign.
Let’s edit our “Initial Cat Owners Campaign” and navigate to its Forecasting tab to get started.

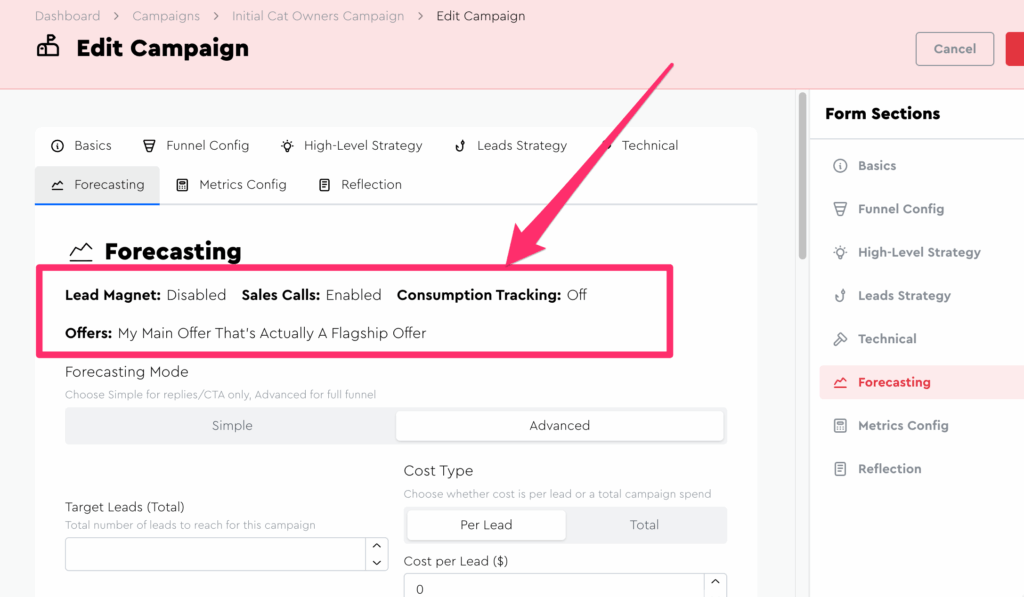
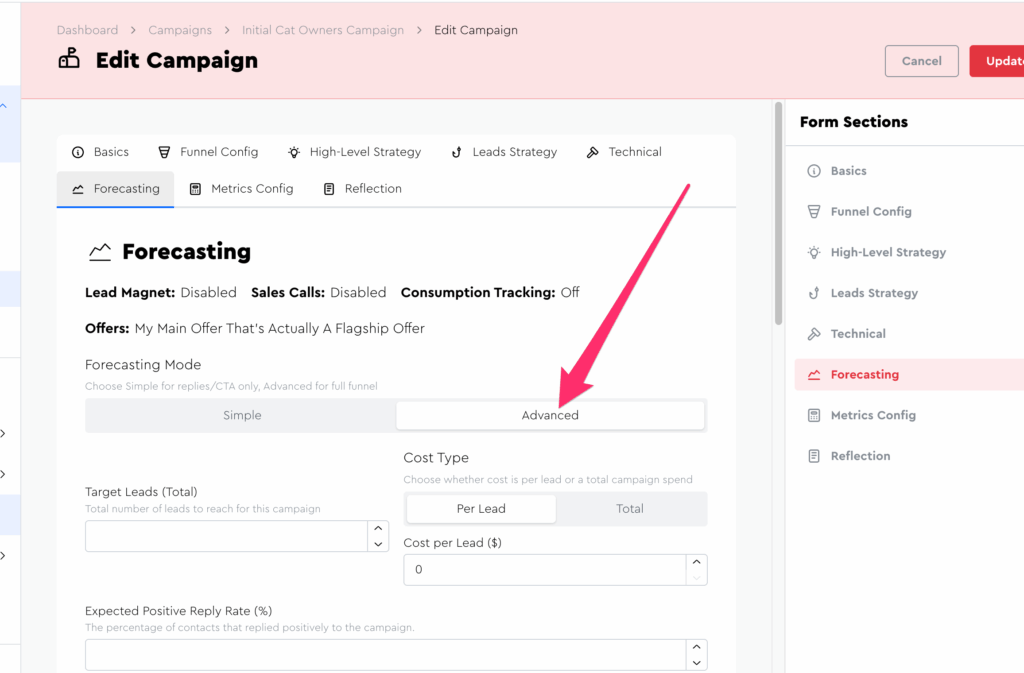
Right off the bat, you’ll notice that the top tells you a little bit about how your campaign’s funnel is currently configured, which affects what shows up in the forecaster:
You’ll also notice that there’s a forecasting mode form control:
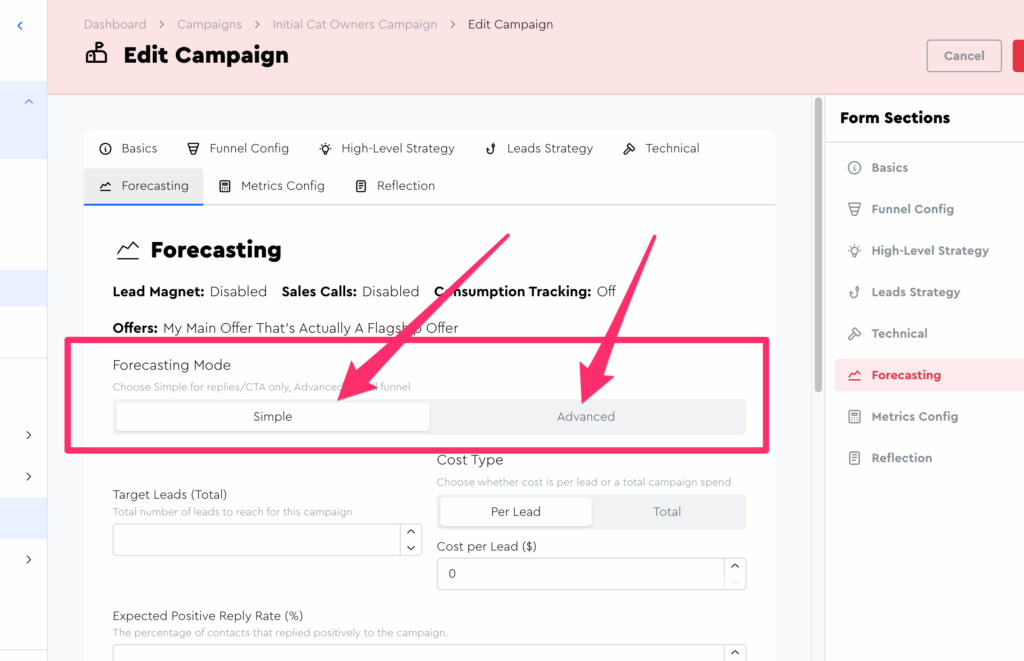
This control’s setting affects the amount of funnel stages, conversion rates, and “at a glance metric boxes” that show in the forecaster, as well as the number of “conversion rate expectation fields” you can set. It’s essentially a control for “how nerdy and granular you want to get.”
For now, ensure it’s set to the “Simple” mode.
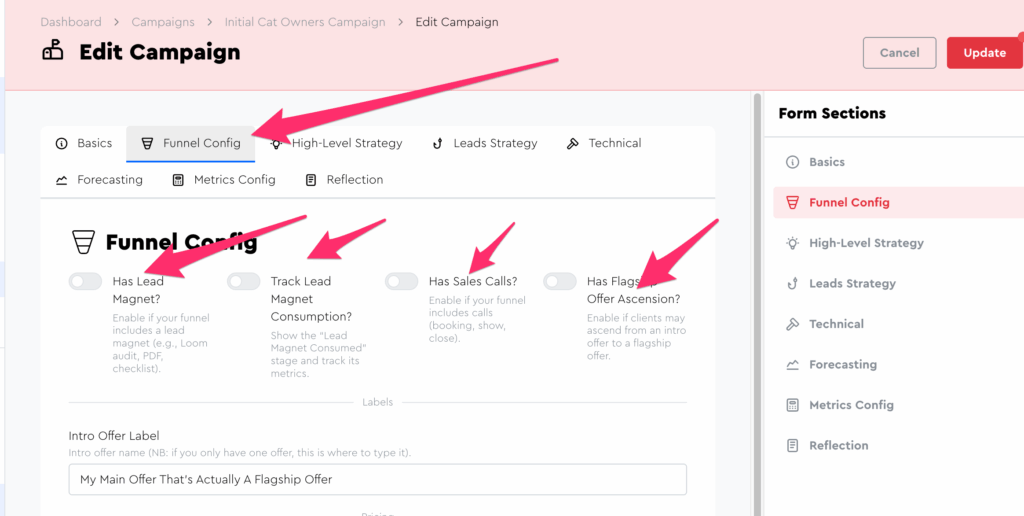
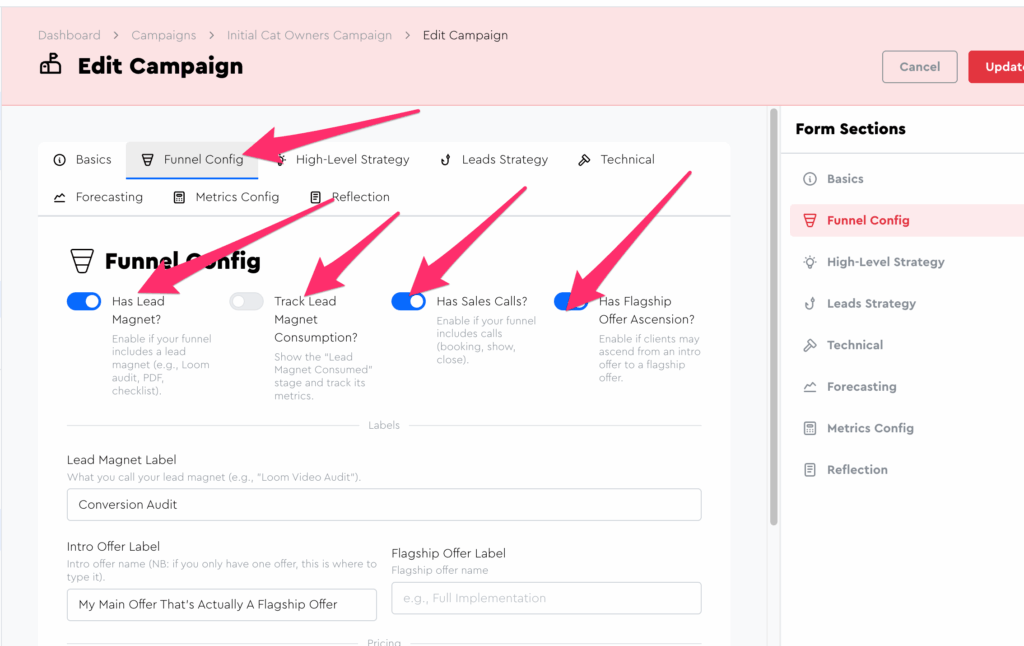
Let’s next take a moment to adjust our funnel config and see how it affects the forecaster. Go to the “Funnel Config” tab and disable all the toggles to essentially make a “spam funnel”:
Now if you go back to the “Forecasting” tab and scroll to the bottom, you’ll see that only 2 stages are displayed *Total Contacts & Positive Replies):
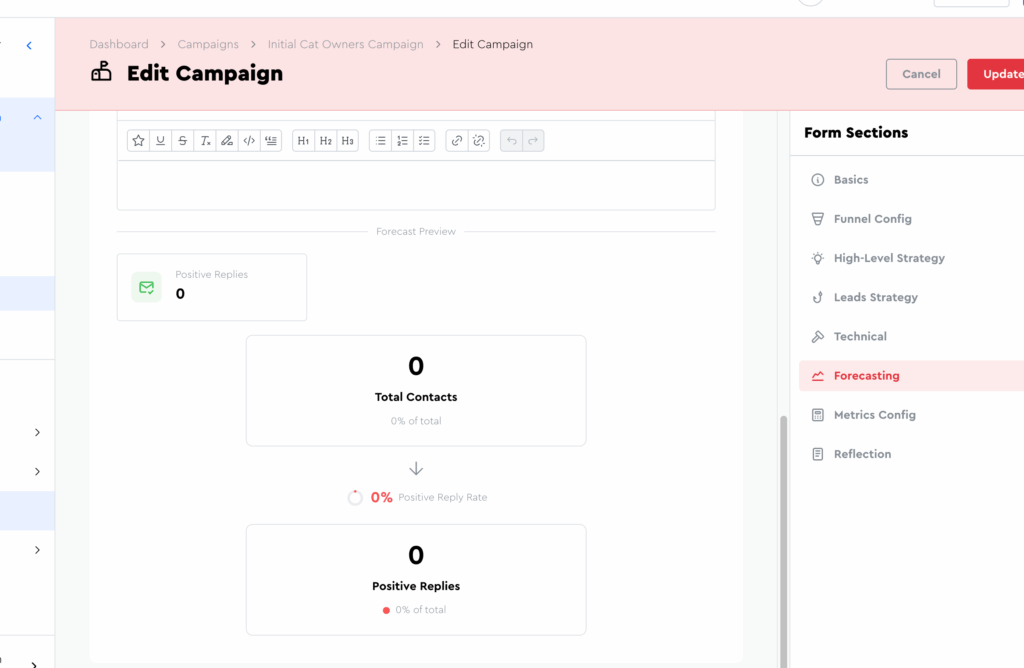
The reason just 2 stages are displayed is because “Simple mode” doesn’t concern itself with clients closed; it’s only focused on the very top of the funnel. (Leads)
Now scroll up and toggle advanced mode on:
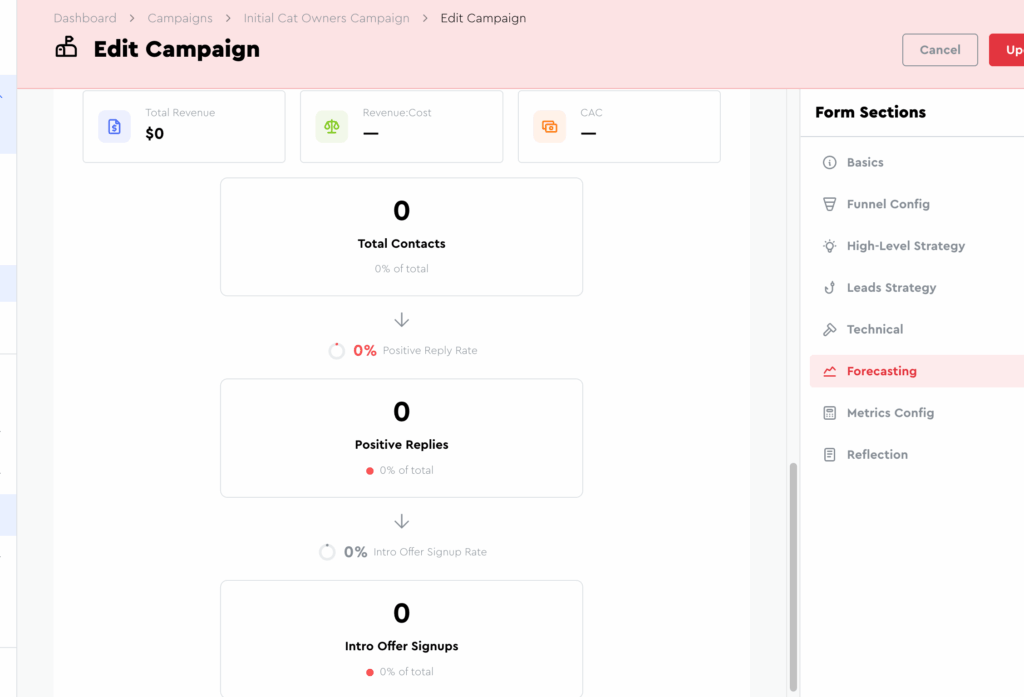
Scroll down again and you should see 3 stages, including the Intro Offer Signups one:
Now let’s see how things change with different a funnel config!
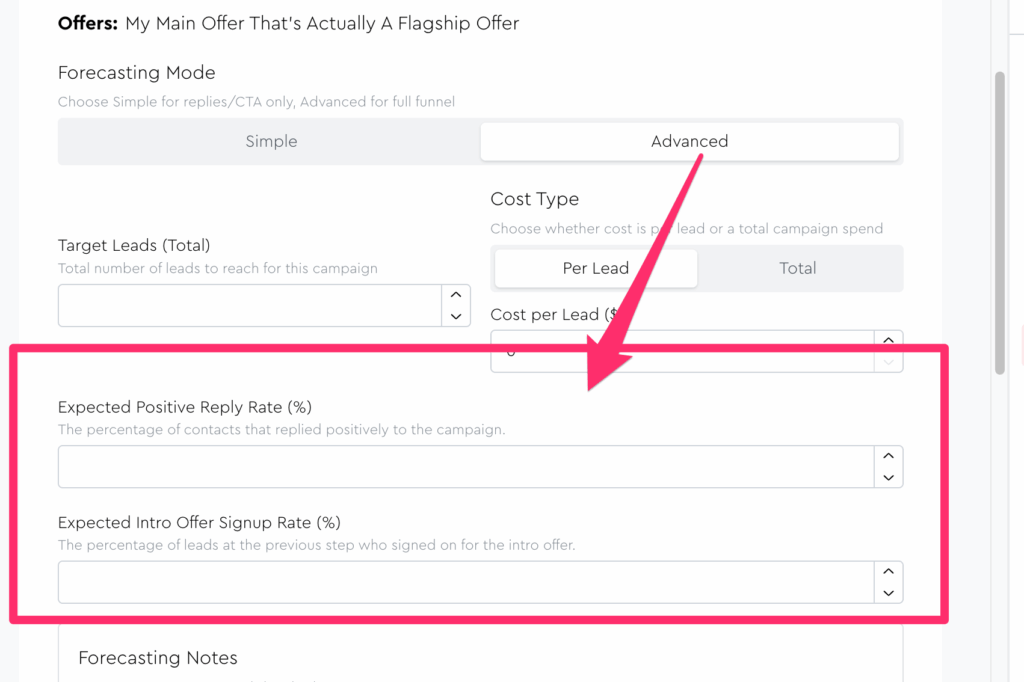
Before we do though, I want you to observe how the fields at the top change depending on mode (and soon depending on funnel config). Scroll up to the top and observe how “advanced mode” renders out 2 “expectation fields” for you to fill:
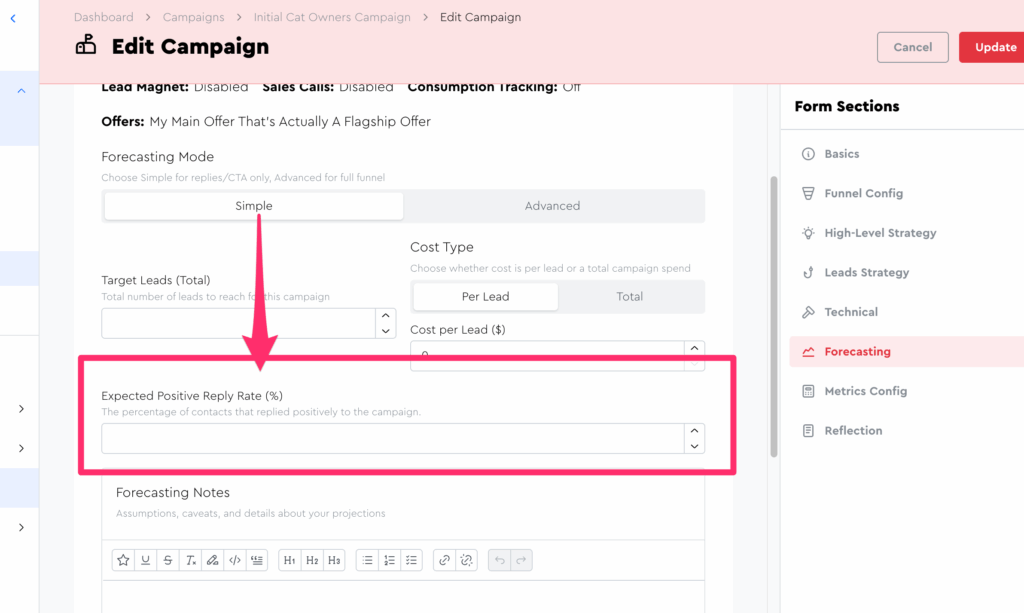
Whereas if you were to switch it to “Simple mode” you’d just have one:
And thus, you now maybe are starting to understand the relationship between the fields at the top and the things that render below in the forecaster.
Before we start playing with the expectations fields, let’s get our funnel back to a more normal setup.
Go back to the “Funnel config” tab and enable all stages except for “Lead Magnet Consumption.” (This is the default for new campaigns)
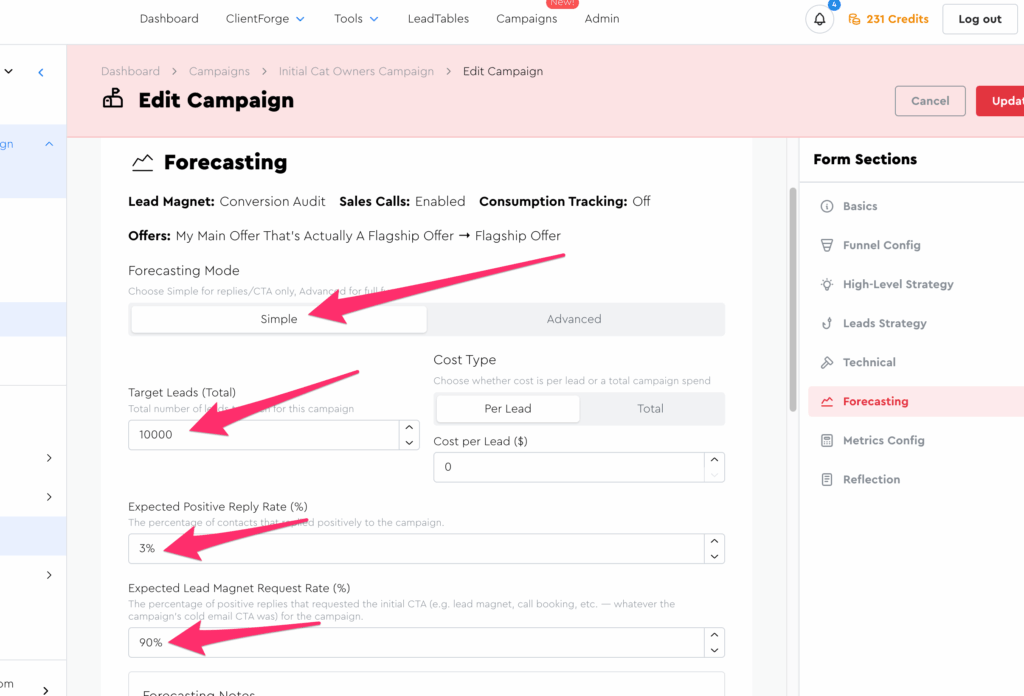
Now go back to the forecaster tab, choose “Simple” mode, and fill out the following expectations:
- Target Leads: 10,000
- Expected Positive Reply Rate: 3%
- Expected Lead Magnet Request Rate: 90%
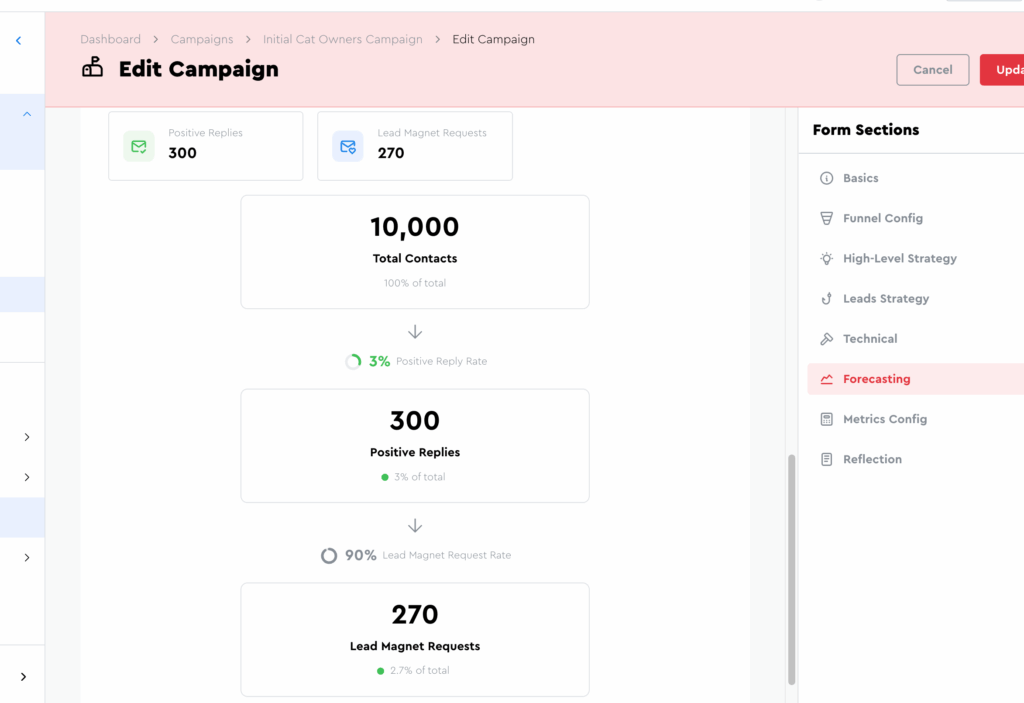
Now if you scroll down to the bottom of the page, you should see a forecast of the amount of engaged leads you’ll get based on these expectations:
Now go back up and enable advanced mode.
Then fill these new expectations that appear:
- Expected Call Booking Rate: 30%
- Expected Call Show Rate: 80%
- Expected Intro Offer Signup Rate: 40%
- Expected Flagship Offer Signup Rate: 50%
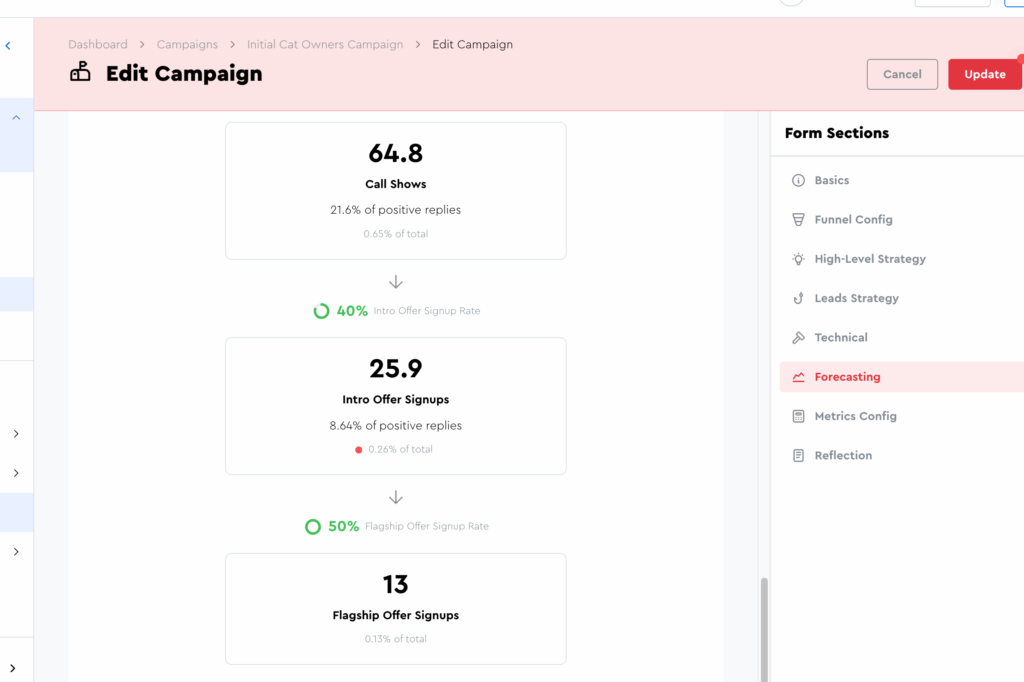
If you now scroll to the bottom, you’ll see more detailed projections showing you how many clients you’ll get if your expectations are accurate:
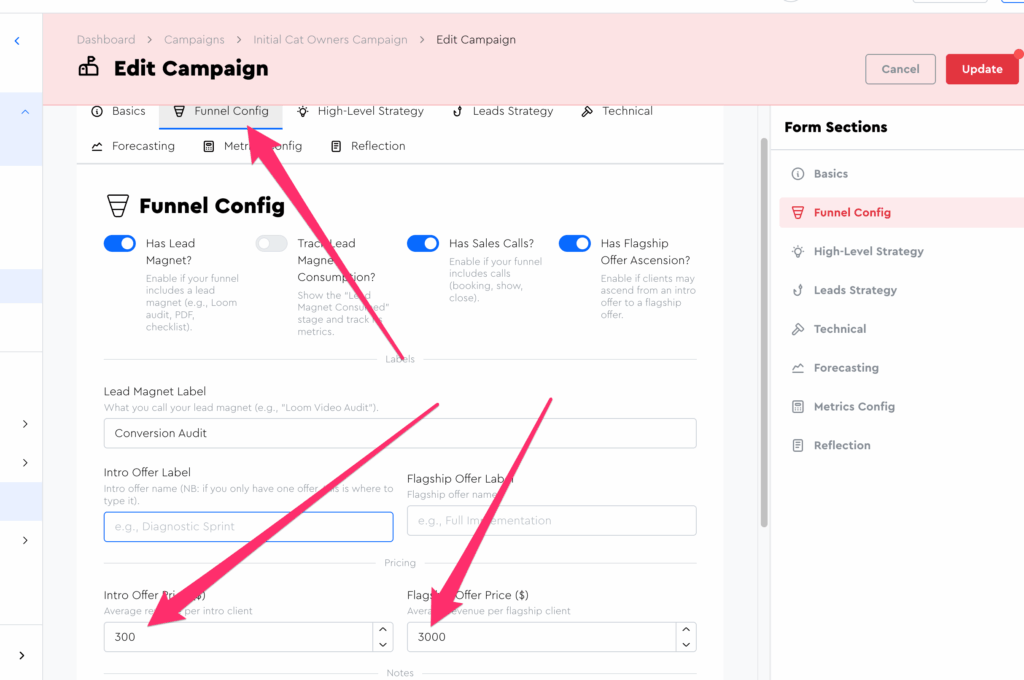
Finally, let’s go back to the funnel config tab and set your Intro Offer price to $300 and your Flagship Offer price to $3,000:
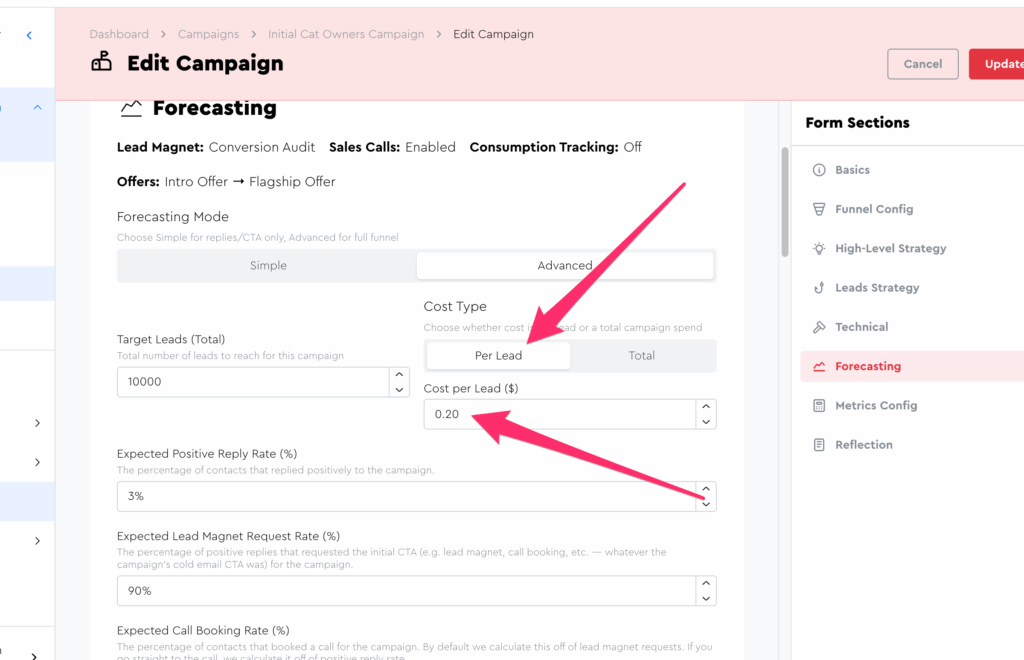
Now go back to your Forecasting tab and set your CPL (Cost Per Lead) to $0.20:
Now if you scroll down to the Forecast Preview, you’ll see all sorts of juicy juicy data:
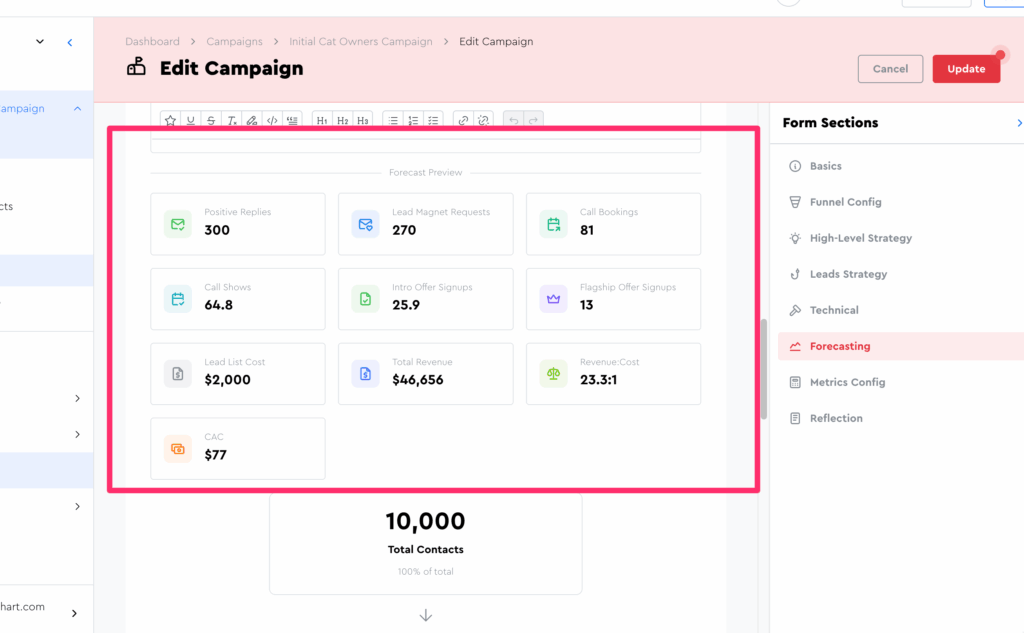
Cool, eh!?
The metrics we had you enter are pretty doable/exceedable with the right training (cough cough $200KF nudge nudge cough) and campaign iteration + optimization; and for me, it’s nice to see what’s possible with scale to help me plan how many leads I need to get to reach my revenue goals.
💡 Pro Tip! You can fill out a forecaster for a campaign and click the “Update” button to actually store these forecaster values for the campaign. Then, when the campaign is finished running, you can compare your actual metrics to your expected metrics to see where your expectations were accurate vs. off!